
Figure 4. EMSA demonstrating the interaction between FimR and pfim .
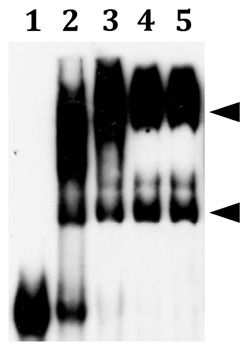
Lanes 1 to 4 are reactions containing 0, 20, 40, and 80 µM His-FimR, respectively; lane 5 is reaction containing 80 µM His-FimR and unlabeled tcrB. The positions of the FimR-probe complexes are indicated by triangles.