
Figure 5. ChIP-qPCR demonstrating the relative quantity of pfim bound by FimR.
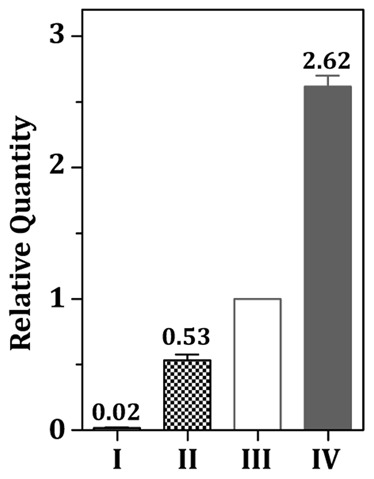
Cells were grown under 0.01 µM MnCl2 and 0.1 µM FeSO4 (I), 0.01 µM MnCl2 and 50 µM FeSO4 (II), 50 µM MnCl2 and 0.1 µM FeSO4 (III), and 50 µM MnCl2 and 50 µM FeSO4 (IV). The ΔCq of the sample from III was used as the reference. Significant differences between samples were determined using one-way ANOVA. A significant difference (P<0.05) was detected between all pairs of comparison.