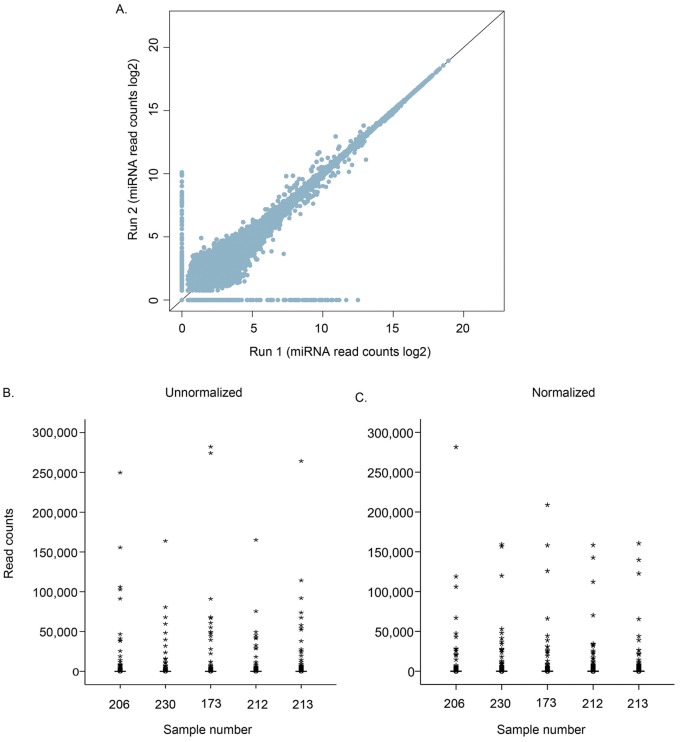
Figure 2. Technical replicates and normalization of miRNA read counts.
A. Comparison of the technical replicates between run 1 and run 2. Each dot represents the total expression of a single miRNA from all the patient samples. The miRNA expression data was normalized and log2 transformed. B. Unnormalized miRNA read counts (log2) for five randomly selected patients. C. Normalized miRNA read counts (log2) for the same five patients as in B.

