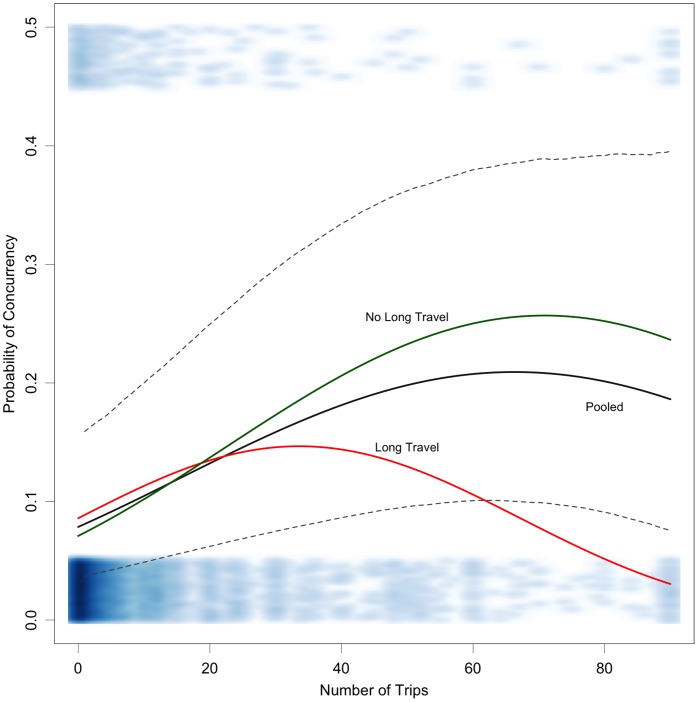
Figure 1. Relationship between number of overnight trips and the probability of any concurrent partnerships in the past year among men.
The blue band at the bottom shows the data density by number of trips among those with partnership concurrency; the band at the top shows is the density for those who did report a concurrent partnership. Long travel represents men who reported travel of one month or longer in the last 12 months.

