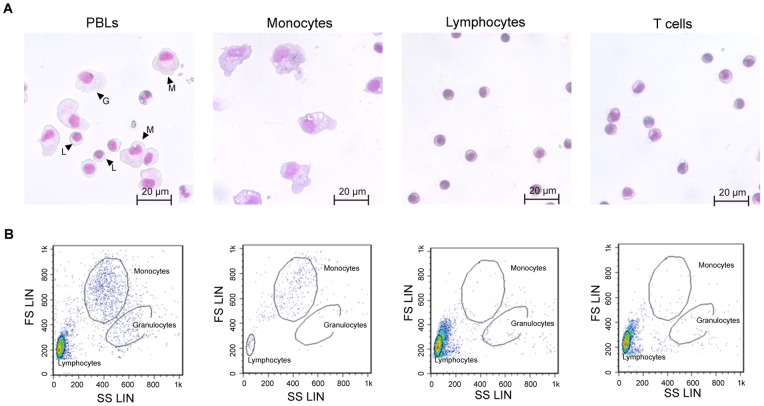
Figure 3. Discrimination of Fugu PBLs, monocytes, lymphocytes and T cells.
A) The morphology of purified cells was examined by microscope after May-Grünwald-Giemsa staining. G, L and M indicate granulocytes, lymphocytes and monocytes, respectively. B) Scattergram of the flow cytometric profile of purified cells. Different cell subpopulations were identified on the basis of their size and complexity, and cellular debris was excluded. Three populations (granulocytes, monocytes and lymphocytes) in PBLs were isolated by analytical gates. The monocyte, lymphocyte and T cell populations were mostly pure, and contamination with other populations was low.

