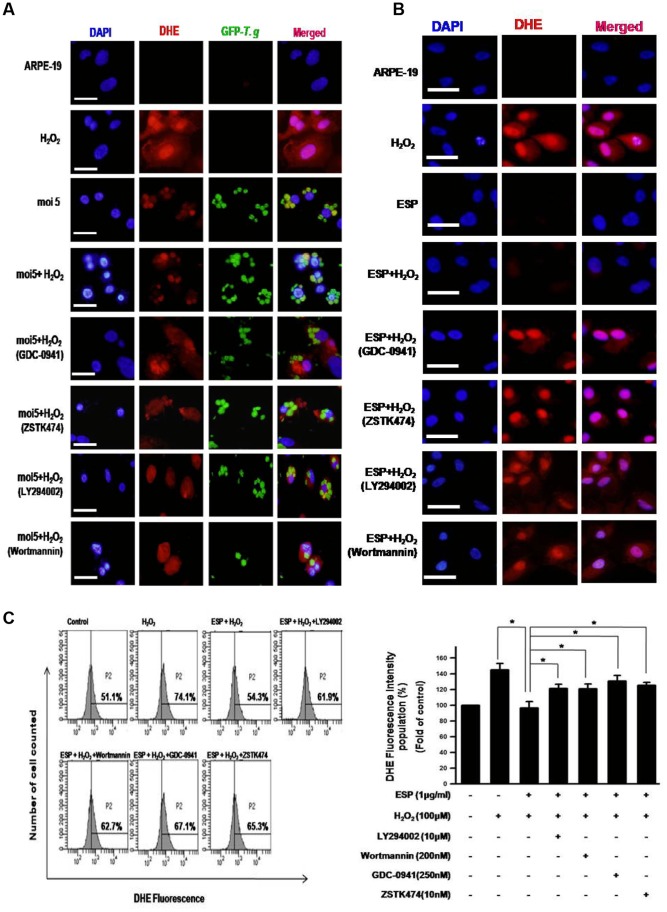
Figure 3. T. gondii and ESP inhibited H2O2-induced ROS generation via activation of PI3K/Akt signaling.
Fluorescence microscopy images of cells stained with 10 µM DHE and treated with different conditions. ARPE-19 cells were infected with GFP-RH for 23 h (A, B), or ARPE-19 cells were stimulated with ESP for 1 h (C, D). These cell were exposed to 100 µM H2O2 with or without inhibitor for 1 h. The ROS level change by ESP and PI3K inhibitors under oxidative stress (H2O2) were quantitatively analyzed by flow cytometry (E). Results are representative of three independent experiments. * denotes p<0.05, and these differences were considered significant. Scale bar = 100 µM.

