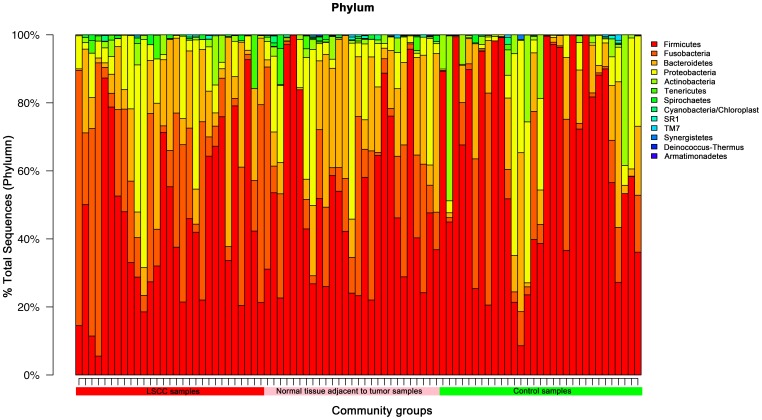
Figure 2. The detailing percentage of phyla with each laryngeal sample that involved the LSCC, normal tissue adjacent to tumor, and control groups.
Color bars in the top-right corner indicate the phyla detected in the current study. Each color is an individual phylum, and each column is a laryngeal sample.

