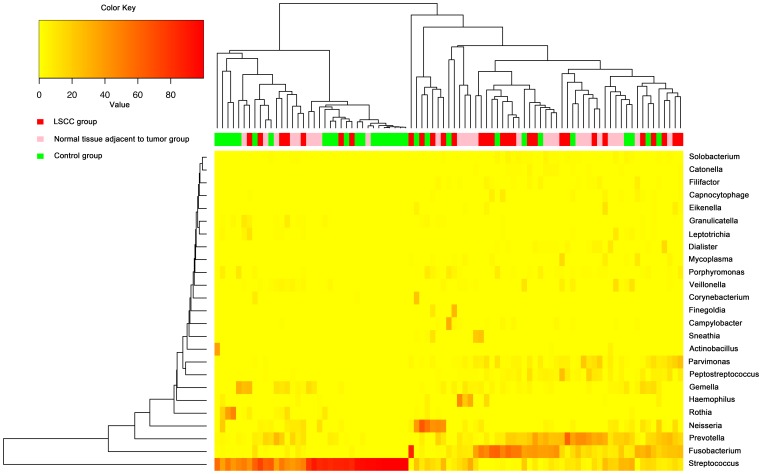
Figure 3. Heatmap of percentages of the main genera in the larynx of each individual based on 16S rRNA sequences.
Complete linkage clustering of samples of the three groups (LSCC tumors, normal tissues adjacent to tumors, and controls) based on genera composition and abundance in communities. Each row is an individual genus, and each column is a laryngeal sample. Color key and color bars are indicated in the top-left corner.

