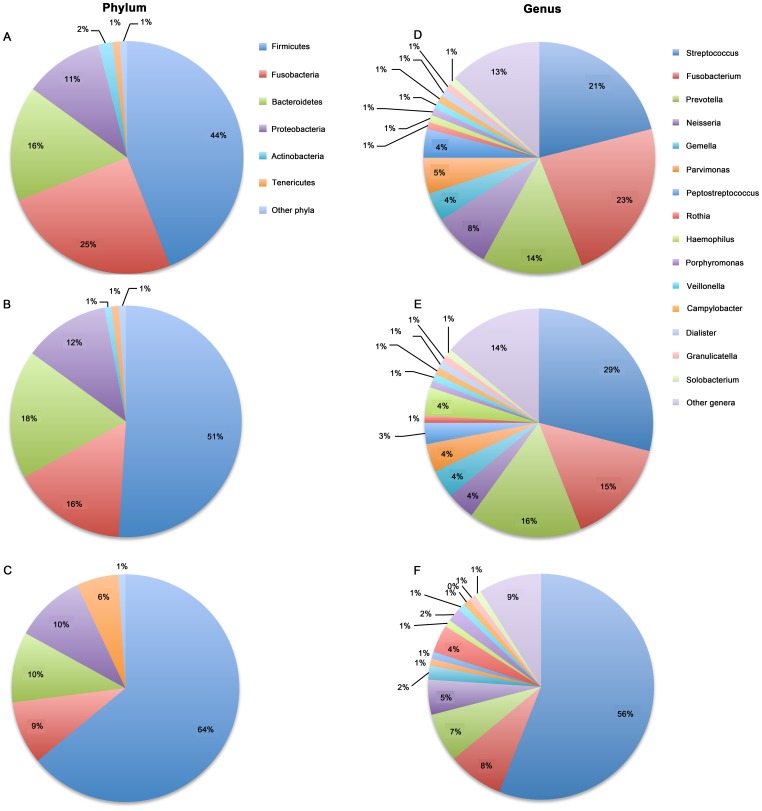
Figure 5. Relative abundance of the main bacterial phyla and genera in the larynx.
Microbial profiles within the LSCC tumor (A), normal tissue adjacent to tumor (B), and control groups (C) at the level of phyla. Microbial profiles in the LSCC tumor (D), normal tissue adjacent to tumor (E), and control groups (F) at the level of genera. The values are mean sequence abundances in each group and each level. Color bars in the top-right of each column are indicated the main phyla and genera.

