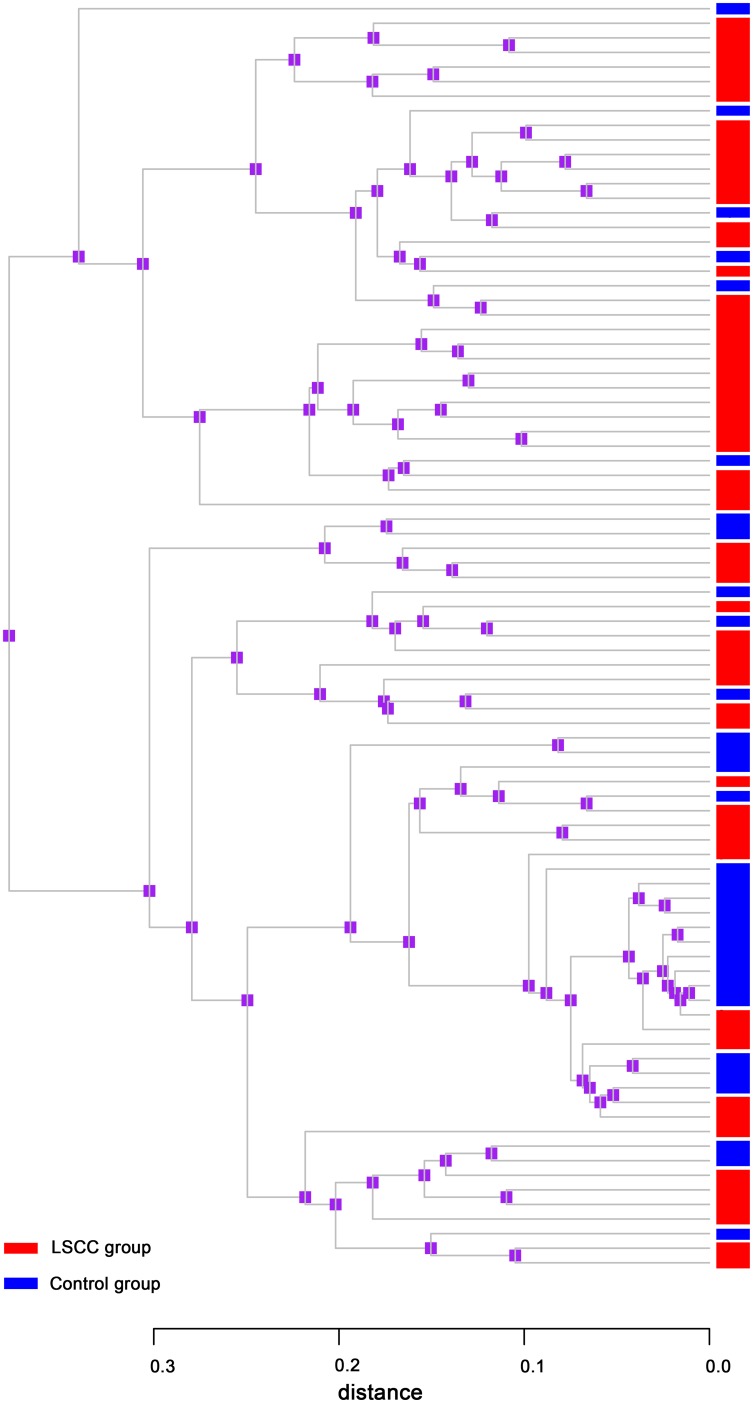
Figure 6. Weighted UniFrac tree from cluster analyses with laryngeal cancer patients and controls.
The scale bar indicates a weighted UniFrac distance from 0 to 0.3. Samples from the control and cancer groups tended to cluster together referring to the different healthy conditions. Color bars of the lower -left indicate the LSCC and control groups.

