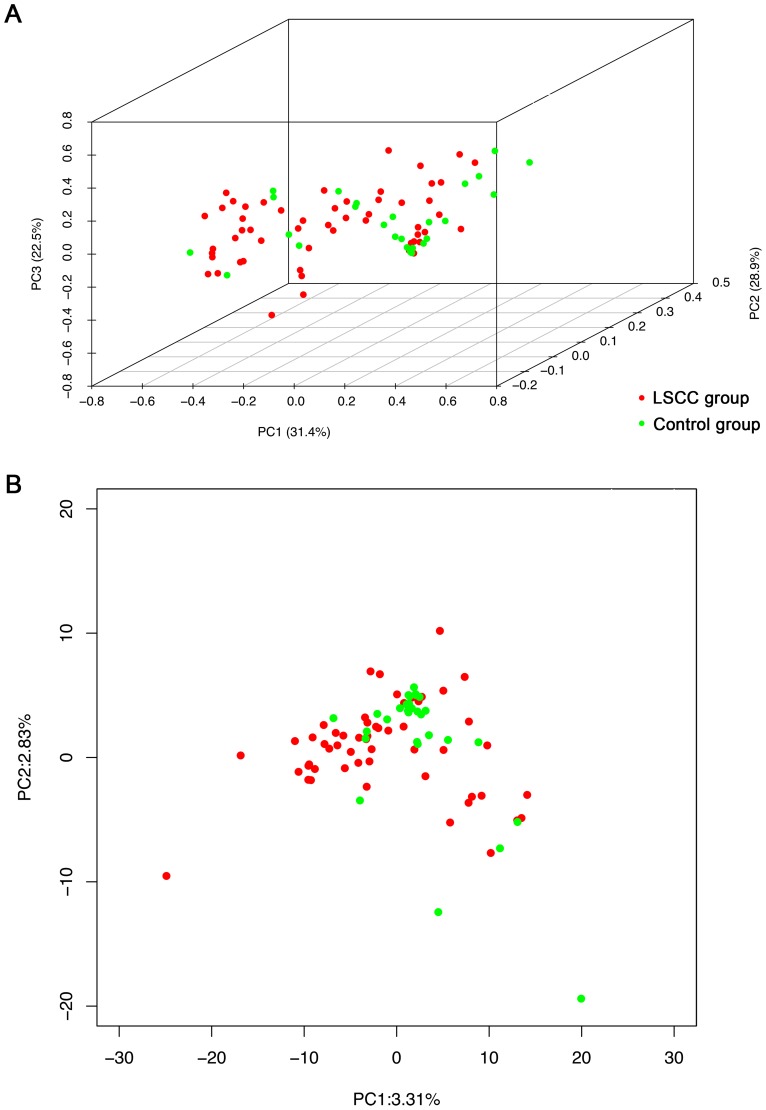
Figure 7. Bacterial diversity clustering by laryngeal cancer patients and controls.
Principal coordinates analysis (p = 0.006) and principal component analysis (p = 0.01) of the LSCC (red) population and control subjects (green) based on community composition and abundance. Each symbol represents a sample. The variances explained by the analyses were indicated in parentheses on the axes. Laryngeal cancer and control samples almost group together according to the different healthy conditions.

