
Figure 3. NANOMS reports on RNAi-mediated depletion of NMT.
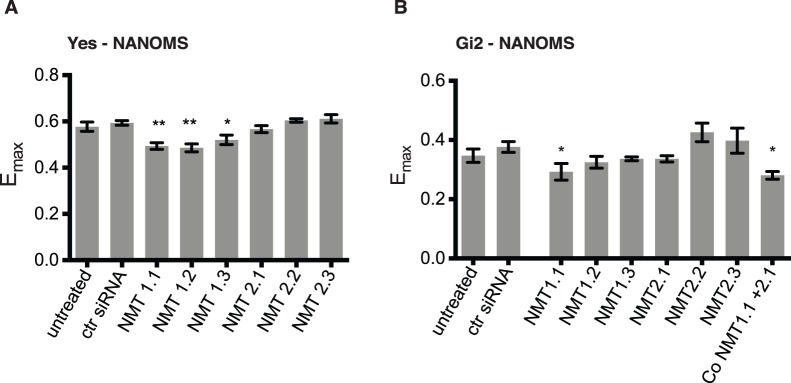
(A) HEK293 EBNA cells transiently expressing Yes-NANOMS and (B) HEK293 cells transiently expressing Gi2-NANOMS were treated with NMT1 or NMT2 specific siRNAs or control siRNA. Knock-down efficiencies are shown in Figure S4. The characteristic Emax-value was determined on flow cytometric FRET data. The error bars denote the s.e.m (n = 4). Samples were statistically compared with the untreated control. See Methods for more on statistical analysis.