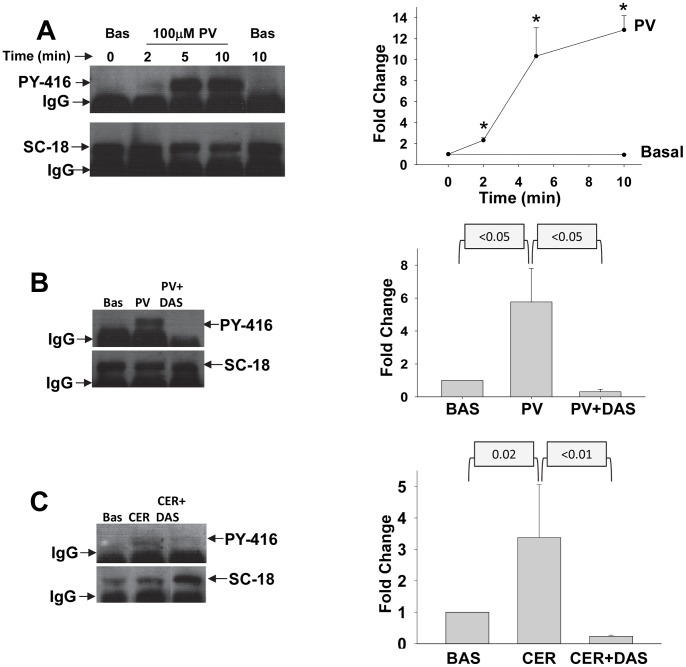
Figure 1. Src is activated by pervanadate and supramaximal Caerulein.
Western-blot of immunoprecipitated Src after treatment of acini with 100 µM pervanadate (PV) for various times (A), 2 minutes of 100 µM pervanadate with or without pre-incubation with 10 µM Dasatinib (DAS) (B) or 100 nM caerulein (CER) with or without pre-incubation with 10 µM Dasatinib (Das) (C). These were blotted for antibodies to Src PY416 (i.e. active Src, upper panel), and then stripped and blotted for Total Src (SC-18, Lower panel). Corresponding graphs shown on the right show active Src levels (PY-416) as a ratio to total Src (SC-18) depicted as fold change over basal (BAS). Each data point was calculated from 3 or more experiments. For figure 1A, the graph depicts fold increase over BAS at the time of adding the stimulus and the asterisks in the graph depict a p value of ≤0.02. p values for the graphs corresponding to figure 1B, C are mentioned above these.

