
Figure 1. Performed and received abnormal behaviours for all pig categories.
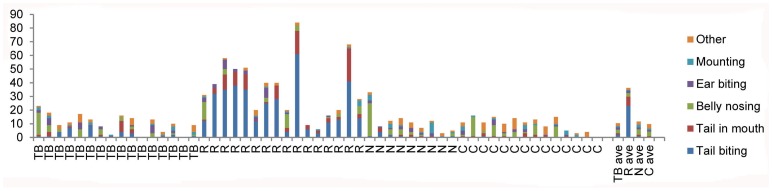
The number of performed (Figure A) and received (B) tail biting, tail in mouth, belly nosing, ear biting, mounting, bar biting and other for all the 56 pigs (tail biters; TB, receivers; R, neutrals, N, controls, C) that were sampled in the present study as well as in [6]. The four bars to the right represent the average (Ave) performed behaviours for each pig category. Only a few of the animals included in this figure were later used in the microarrays.