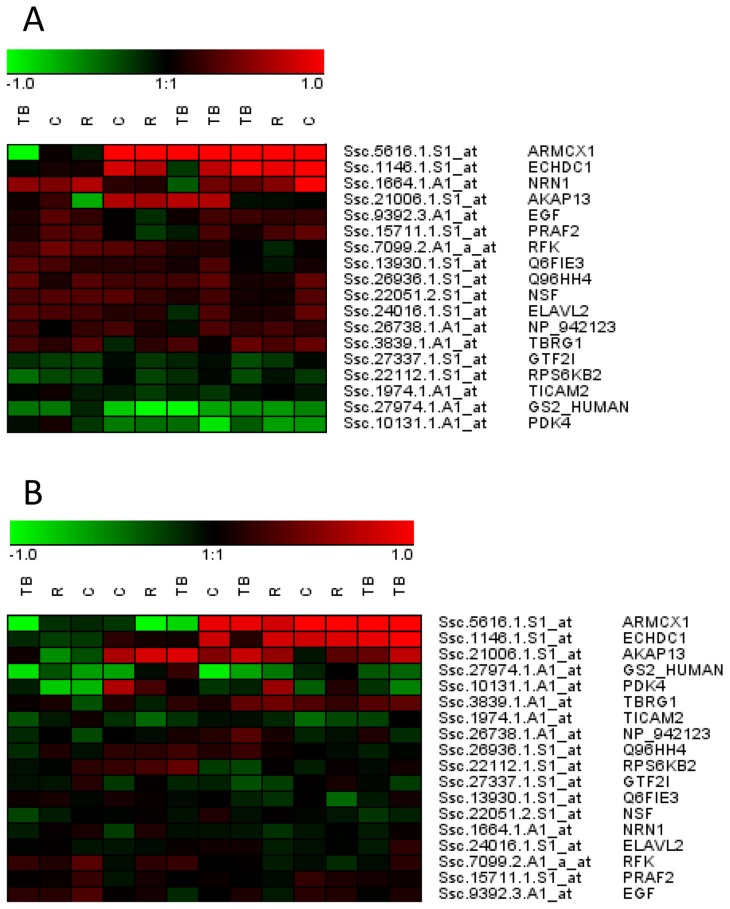
Figure 3. Heat maps containing genes that were differently expressed in neutral pigs compared to all other pig categories.
Each spot in the figure represent the expression difference in the individual tail biters (TB), receivers (R) and controls (C) compared with the neutral pig in the same batch, in hypothalamus (Figure A) and prefrontal cortex (B). A green colour means that the gene is less expressed in the individual compared to the corresponding neutral pig, while a red colour means that it is more expressed.

