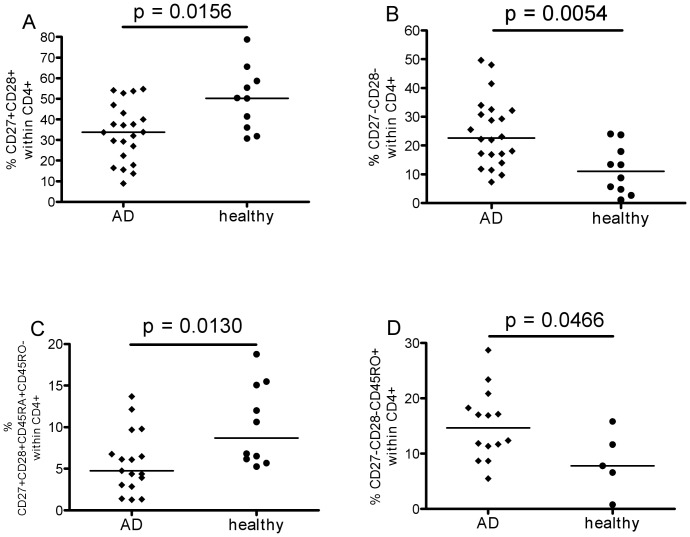
Figure 2. Naïve and memory CD4+ T-cells.
Percentages of early-differentiated CD4+ T-cells in A (CD27+CD28+) and C (CD27+CD28+CD45RA+CD45RO-); percentages of late-differentiated T-cells in B (CD27-CD28-) and D (CD27-CD28-CD45RO+). For statistical analysis Mann Whitney test was applied and resulting p values are displayed.

