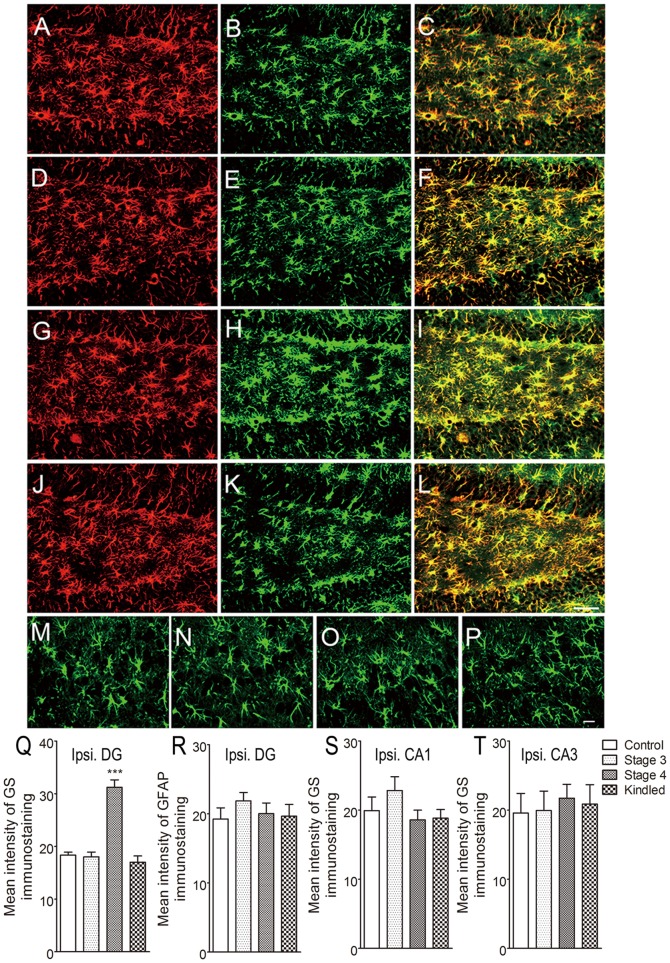
Figure 1. GS overexpression in the ipsilateral DG area in the rat amygdala kindling model.
Immunoreactivity of GFAP (red) and GS (green) in the ipsilateral DG (A–L, bar = 50 µm) and the CA3 region (M–P, bar = 20 µm) during seizure acquisition induced by amygdala kindling (control group, A–C; stages 1–2, not shown; stage 3, D–F; stage 4, G–I; fully kindled, J–L; n = 6/stage). The mean intensity of GS immunoreactivity in the ipsilateral DG region was significantly increased in stage 4 compared with controls (Q), while no change was observed in GFAP expression (R). GS expression did not change in CA1 (S) and CA3 (T) regions. Data are shown as mean ± SEM. ***P<0.001 compared with controls.

