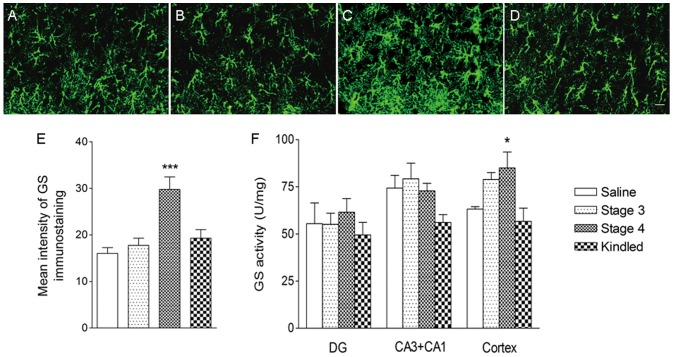
Figure 3. Upregulation of GS function in the cortex in the rat PTZ-kindling model.
GS immunoreactivity (A–E, bar = 20 µm) and activity (F) in the cortex during PTZ kindling. GS upregulation was detected in seizure stage 4 (C, E) compared with the saline group (A). No change was found in other stages (B, D, E) and in other subregions (DG, CA3+CA1; F; n = 5/group). Data are shown as mean ± SEM. *P<0.05 and ***P<0.001 compared with the saline group.

