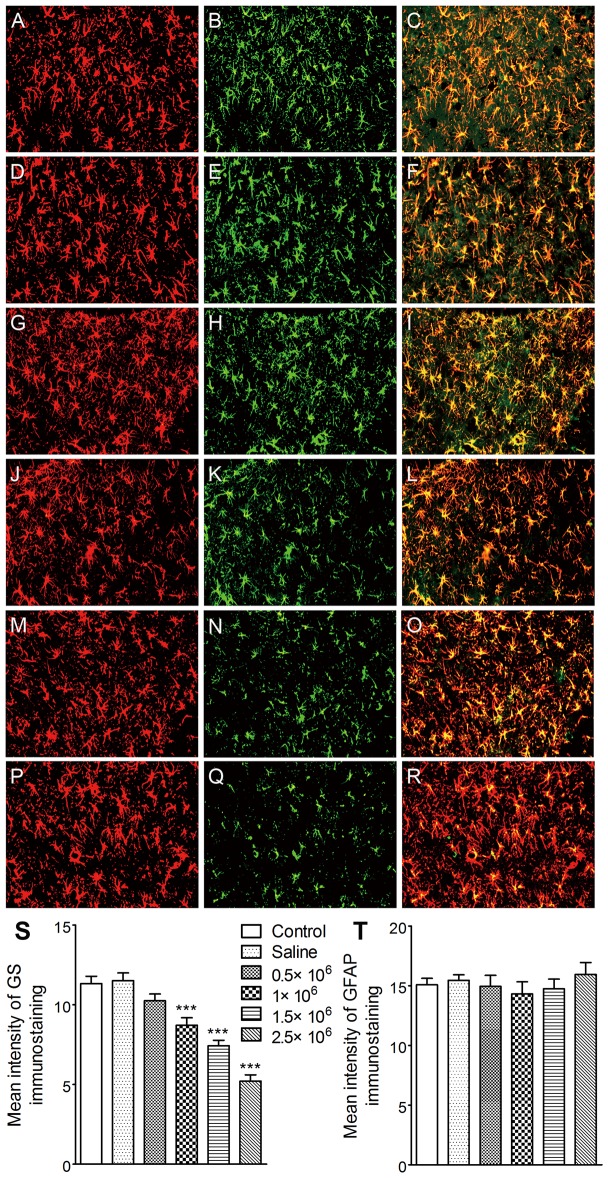
Figure 8. microRNA interference and GS expression.
Artificial microRNA interference vectors (0.5, 1.5, and 2.5×10⁶ TU/2 µl) was injected into the ipsilateral DG on the third day following the first stage 3 seizure on immunoreactivity. (A–R) GFAP (red) and GS (green) (bar = 50 µm) detected on the third day after injection (control (negative vector) group, A–C; saline group, D–F; 0.5×10⁶ TU/2 µl group, G–I; 1×10⁶ TU/2 µl group, J–L; 1.5×10⁶ genome copies group, M–O; 2.5×10⁶ TU/2 µl group, P–R; n = 6/group). The quantitative analysis revealed a titer-dependent inhibition of GS immunoreactivity in the ipsilateral DG region (S), while no change in GFAP expression was observed (T). Data are shown as mean ± SEM. *** P<0.001 compared with the control group.

