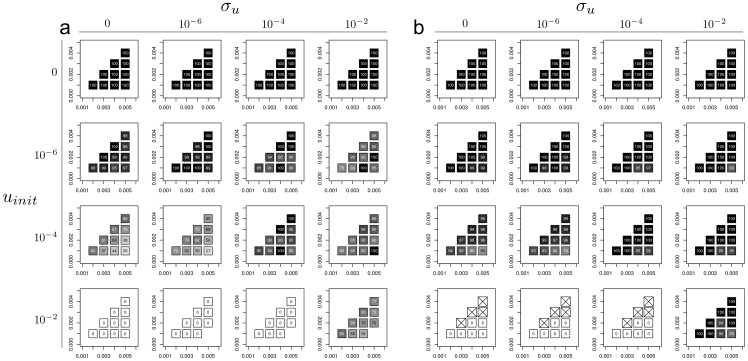
Figure 2. Proportion of sexual lineages at the end of simulations for the model without competition, for different values of the initial transition rate (uinit, rows), the rate of change of this transition rate (σu, columns), the speciation rate of sexual (pS, x-axis on each plot) and the extinction rate of sexual (eS, y-axis on each plot).
Plots a and b differ by the value of α, a parameter that controls the difference between sexual and asexual lineages in terms of extinction rate (asexual lineages have an extinction probability α-times greater than that of sexual lineages). α = 2 in a and α = 5 in b. The shading represents the mean proportion of sexual lineages at the end of the runs (after 3000 generations, 50 repetitions). Cells with crosses (×) represent cases in which all simulations ended prematurely.

