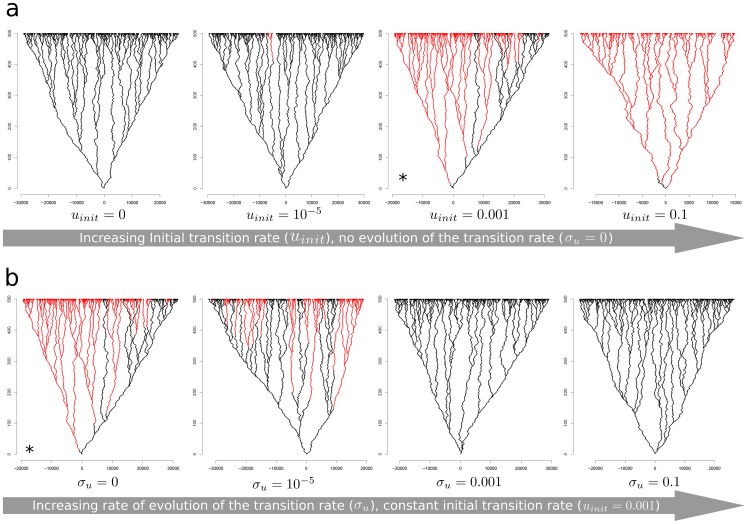
Figure 4. Effect of the initial transition rate (a) and of the rate of change in transition rate (b) on the sexual and asexual lineages formed during simulations, for the model with competition.
Black lines represent sexual forms and red lines represent asexual forms. Extinct lineages are not represented. The tree with a star (*) in a is the same as the tree with a star (*) in b (same set of parameters).

