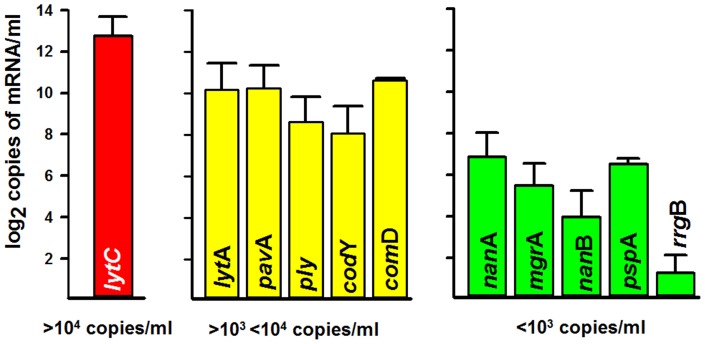
Figure 4. Gene expression studies.
RNA was obtained from a set of NP samples; cDNA was generated and utilized in quantitative PCR reactions targeting pneumococcal genes. The graphic was adjusted to show a log2 scale of copies of mRNA/ml of the indicated gene. A red bar represent more than 104 copies/ml, yellow bars correspond to those expressing >103<104 copies/ml whereas green bars represent genes whose transcripts were detected at <103 copies/ml. Error bars represent the standard error of the mean calculated using data from all tested NP samples.

