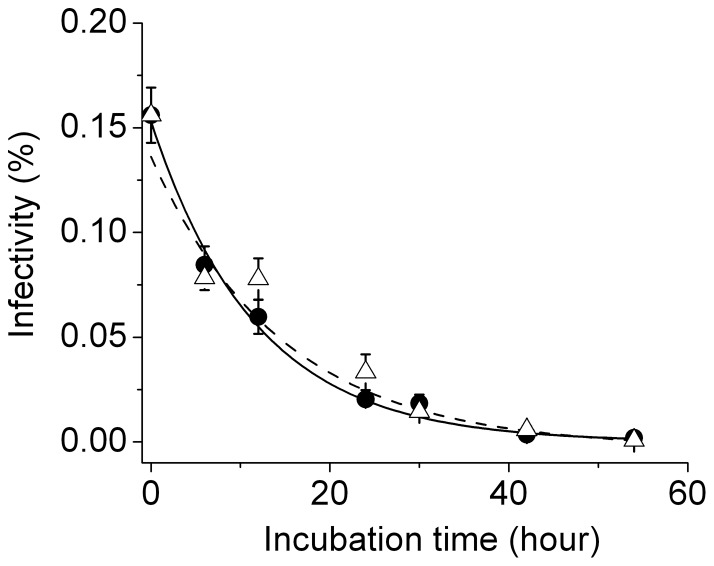
Figure 5. Kinetics of HIV-1 virion infectivity decay.
Time course of HIV-1 virion spontaneous inactivation was measured in either 12-well plate (triangle) and fitted using single exponential decay (dashed line), or in 1.5 ml test tube (circles) and fitted using single exponential decay (solid line). Error bars are standard deviations from three independent replicates of the same experiments.

