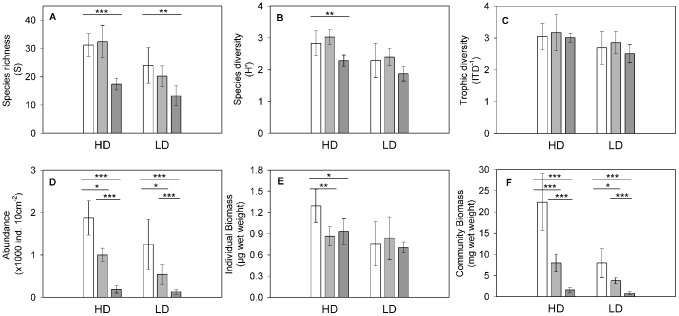
Figure 5. Comparison of the experimental assemblages.
Mean (± standard deviation) of A: Species richness (S), B: Diversity (H’; Index of Shannon Wiener), C: Abundance (individuals per 10 cm−2), D: Trophic diversity (IDT−1), E: Individual biomass (in µg wet weight), and F: Community biomass (in mg wet weight). HD = High diversity, LD = Low diversity. White bars = time0 controls, light gray bars = control temperature (31°C), dark gray bars = high temperature (36°C). Asterisks indicate significance levels after multiple comparisons with Dunnett test between xDt0 and xD31 and xD36 respectively. Significance between xD31 and xD36 were assessed with Student’s t-tests. *<0.05, **<0.01, ***<0.001.

