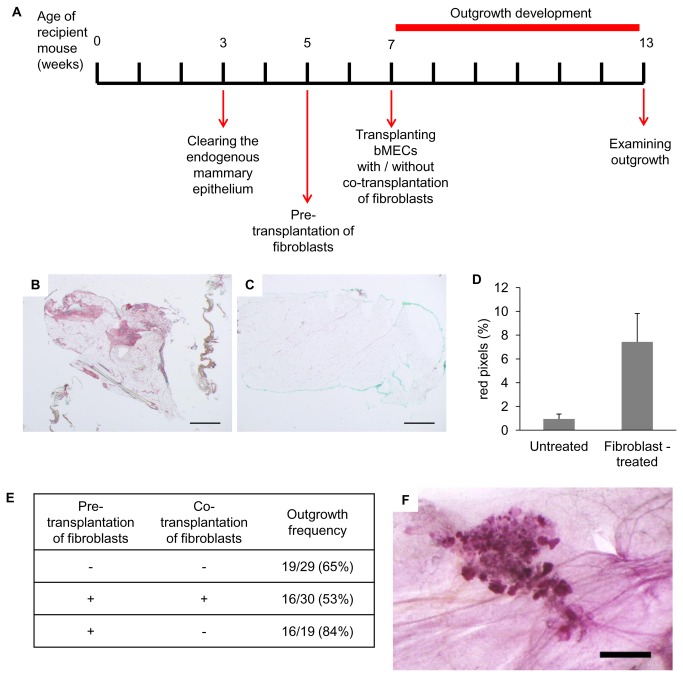
Figure 5. Differential effects for pre- and co-transplantation of fibroblasts on bMEC intake.
A: Timeline of 10T1/2 fibroblast pre- and co-transplantation with bMECs. B, C: Representative Sirius red-stained tissue sections from cleared mammary fat pads, 2 weeks after fibroblast transplantation (B), or without intervention (C). D: The stained fibrotic area is significantly larger in fat pads transplanted with fibroblasts than in intact controls (p = 0.02, n = 5, error bars represent SEM). Percentage of red pixels was calculated using the Adobe Photoshop software. E: Effects of pre- and co-transplantation of fibroblasts on outgrowth frequency. F: Representative Carmine-stained wholemount of bovine outgrowth that developed within the cleared mammary fat pad 2 weeks after fibroblast transplantation. Bar = 1 mm.

