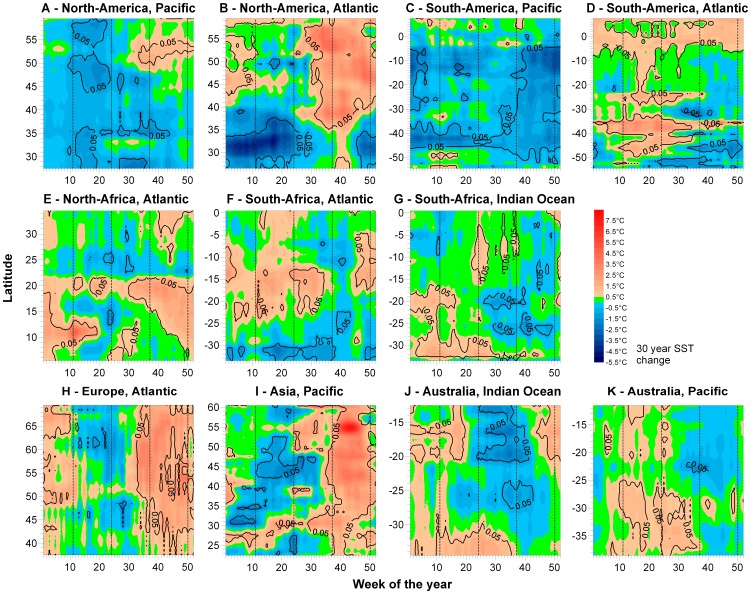
Figure 4. Seasonal decomposition of decadal SST trends in coastal latitudinal temperature gradients.
Contours represent the absolute predicted change in SST for each latitude and week, derived by multiplying the linear regression slope a by 31 years (SSTijk = a*year +b with SST of gradient i, latitude j and week k). Isolines enclose areas of regressions with p<0.05 (overlaid contour). Dashed lines separate the 52 weeks (wks) into spring, summer, fall, and winter seasons in the northern (NH) and southern hemisphere (SH). Wks 12–24: springNH/fallSH, wks 25–37: summerNH/winterSH, wks 38–50: fallNH/springSH, wks 51–11: winterNH/summerSH.

