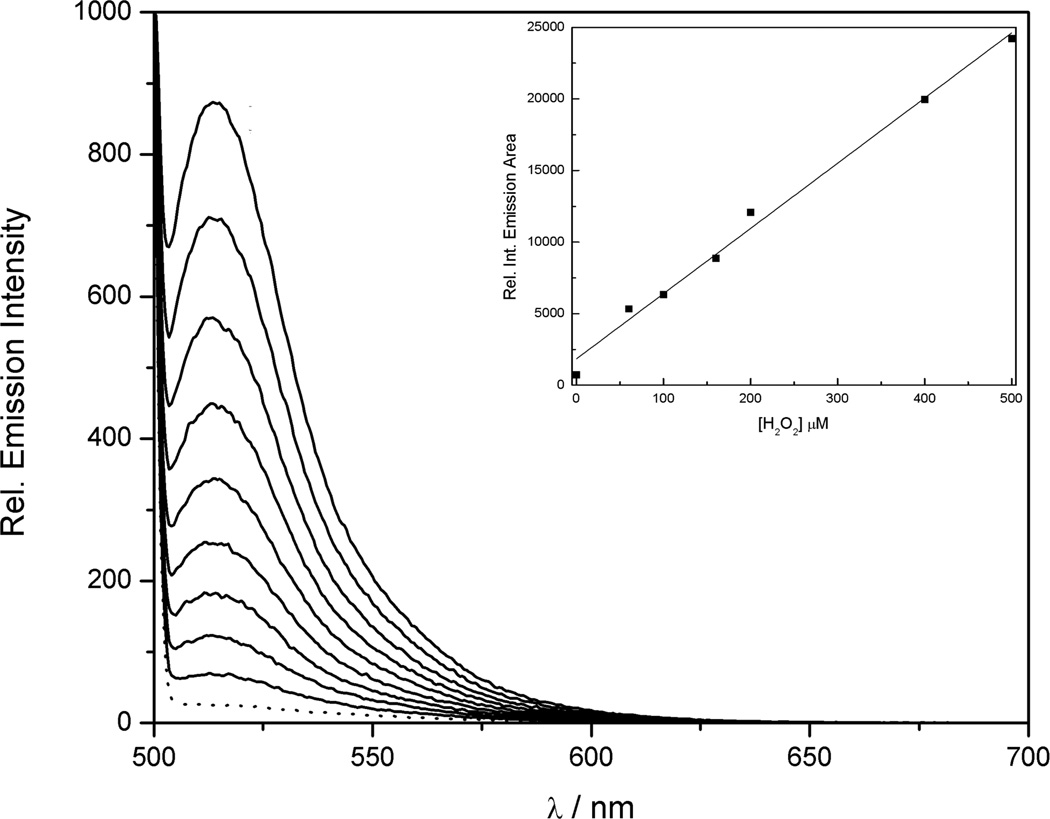
Figure 4.
Fluorescent response of 50 µM FBBBE to H2O2 (5 eq, 250 µM). The dotted line represents the initial spectrum and subsequent spectra were recorded every 4 min after the addition of H2O2. Fluorescent response of 10 µM FBBBE to various concentrations of added H2O2 (insert). Spectra were collected after incubation with H2O2 at room temperature for 15 min. The collected emission was integrated between 500–700 nm (λexc = 480 nm). Spectra were acquired in 50 mM HEPES (pH 7.5).

