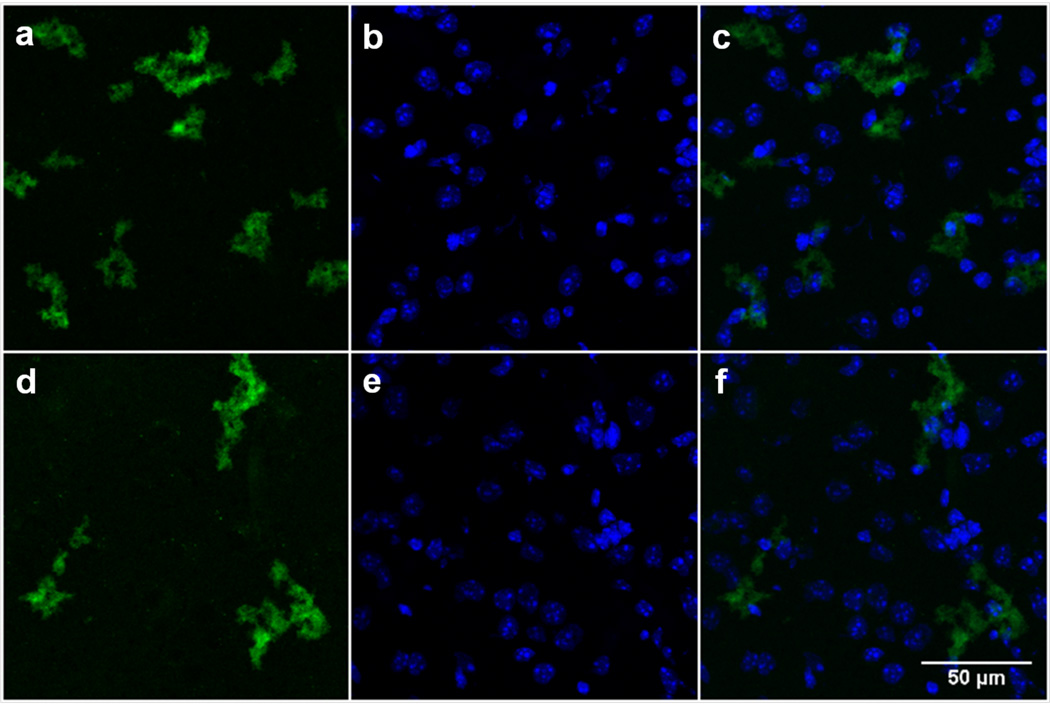
Figure 6.
Confocal fluorescence images of H2O2 in mouse brain treated with FBBBE for 1 h. Brain tissue treated with PBS (a–c) or 100 μM H2O2 (d–f). Images on the left (a, d) are with 50 μM FBBBE; images in the middle (b, e) are nuclear staining with DAPI (4′,6-diamidino-2-phenylindole, blue); and images on the right (c, f) are an overlay of the FBn and DAPI staining.

