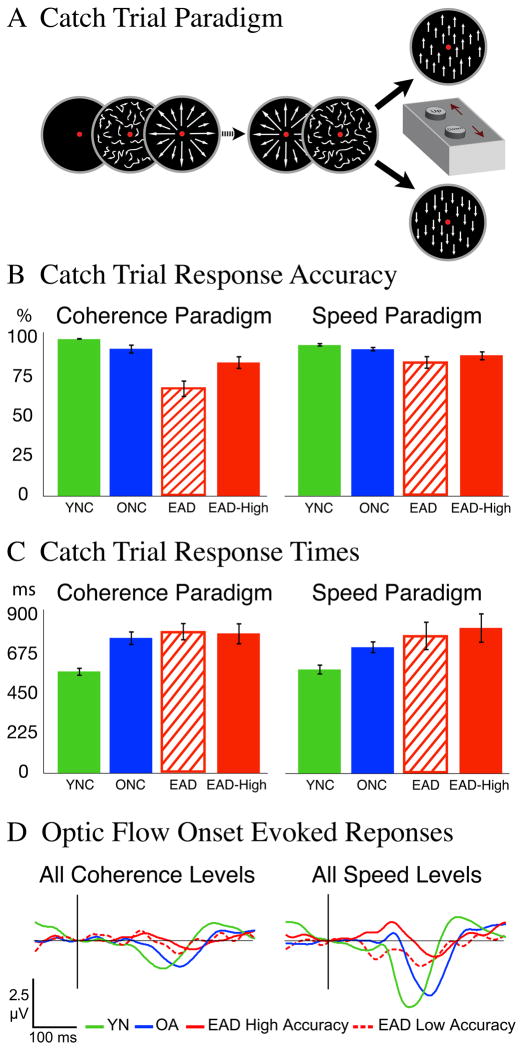
Figure 5.
A behavioral catch paradigm was used to measure of sustained attention in all trials. A. Catch stimuli were presented after 9 to 15 optic flow stimuli and consisted of either upward or downward vertically moving dots with 100% coherence. Subjects pressed the far button for upward motion and the near button for downward motion. B. Response accuracy was measured as the percentage of correct responses across all coherence and speed conditions. Several EADs showed poor task performance and were omitted from a higher accuracy EAD sub-group. YNC subjects showed the greatest accuracy, with decreasing performance from ONCs and EADs. C. Response times (ms) were calculated as the interval between catch stimulus onset and button press. YNC subjects showed the shortest times, with increasing times from ONCs and EADs. D. Averaged N200s from all groups and the higher accuracy EAD sub-group show that group differences are not attributable to attentional differences.

