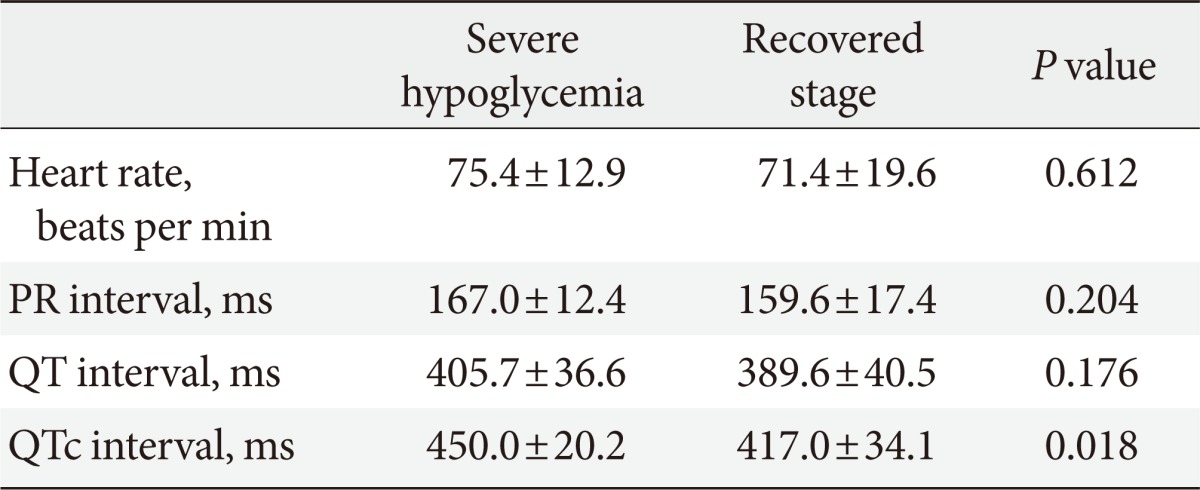
Table 4.
The comparison of electrocardiographic findings between severe hypoglycemia and the recovered stage in only oral glucose-lowering agents users (n=7)

Values are presented as mean±standard deviation.
QTc, corrected QT.
The comparison of electrocardiographic findings between severe hypoglycemia and the recovered stage in only oral glucose-lowering agents users (n=7)

Values are presented as mean±standard deviation.
QTc, corrected QT.