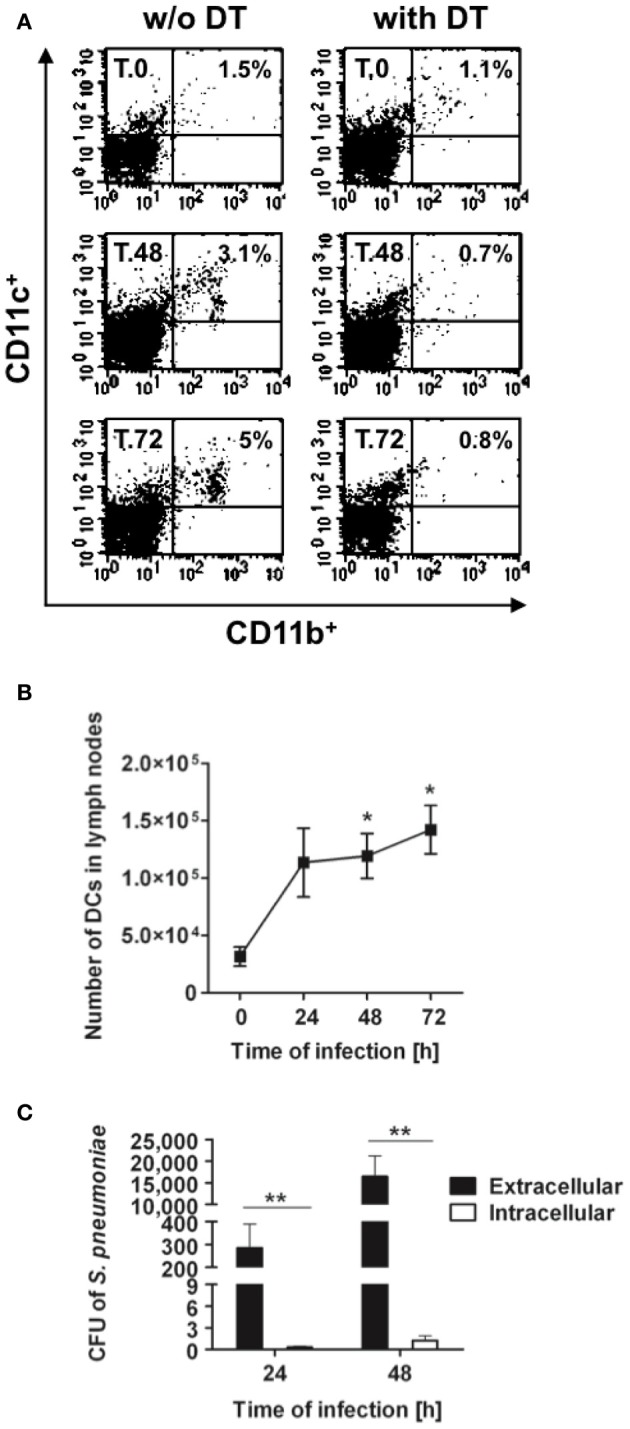
Figure 6.

Trafficking of DCs to the mediastinal lymph nodes after intranasal infection with S. pneumoniae. DCs-depleted and non-depleted CD11c-DTR chimera mice were intranasally infected with 1 × 10⁸ CFU of S. pneumoniae, the mediastinal lymph nodes were removed before (0 h) and at 24, 48, and 72 h after bacterial inoculation and transformed in a single cell suspension. Cells were then counted, stained with anti-mouse CD11c and anti-mouse CD11b antibodies and analyzed by flow cytometry. (A) Representative dot plots of DCs in the mediastinal lymph nodes of S. pneumoniae-infected DCs-depleted (right histograms) and non-depleted (left histograms) mice. The numbers in each dot plot represent the percentage of DCs. One representative experiment out of three is shown. (B) Total amount of DCs in the mediastinal lymph nodes of S. pneumoniae-infected DCs-depleted (white symbols) and non-depleted (black symbols) CD11c-DTR chimera mice. Each symbol represents the mean ± SD of three independent experiments. (C) Quantification of viable intracellular (white bars) and extracellular (black bars) S. pneumoniae in the mediastinal lymph nodes of S. pneumoniae-infected mice at 24 and 48 h after bacterial inoculation. Each bar represents the mean ± SD of triplicate samples. One representative experiment out of three is shown. *p < 0.05 and **p < 0.01.
