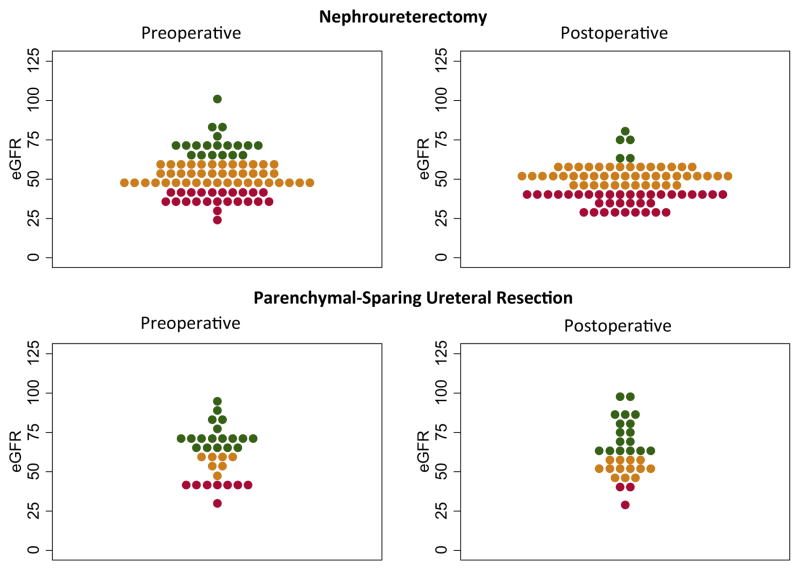
Figure 1.
Comparative scatterplot of eGFR before and after surgery in patients treated with RNU or PSUR. Green represents values greater than 60 ml/minute/1.73 m2, orange represents values between 45 and 60 ml/minute/1.73 m2, and red represents values less than 45 ml/minute/1.73 m2. Each dot represents 1 patient, ie wider bands represent regions with more patients.

