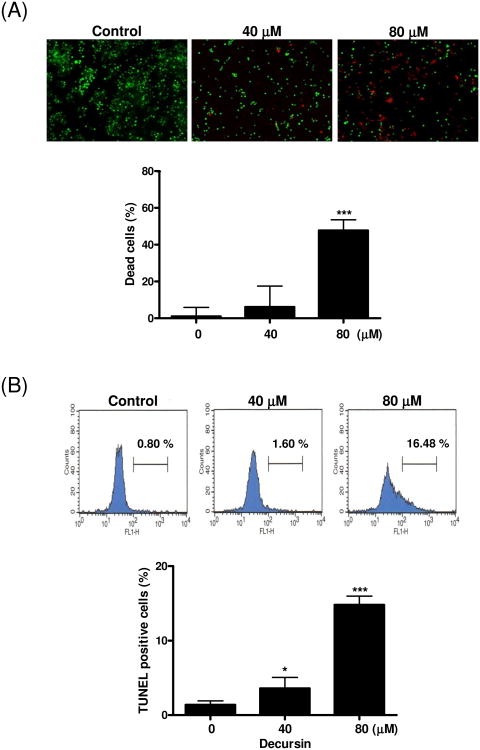
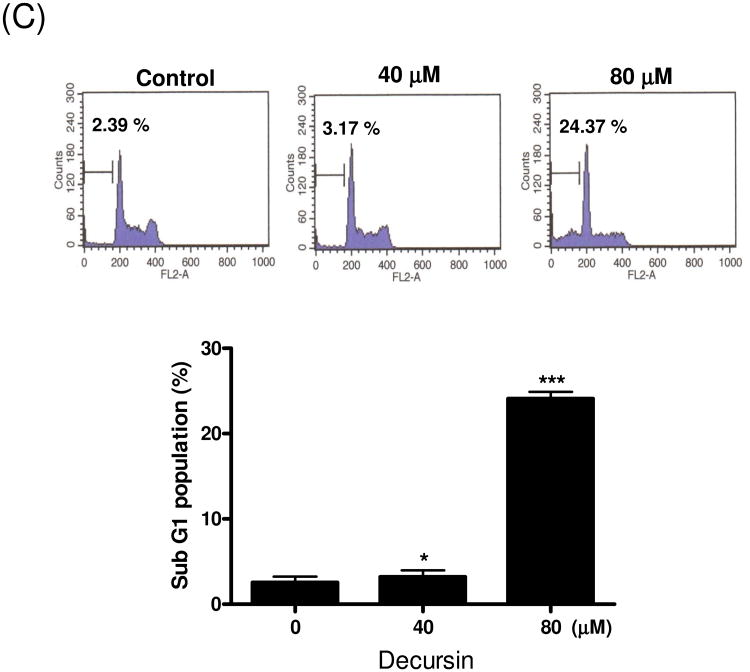
Fig. 2.
Decursin-induced apoptosis in KBM-5 cells. Cells were treated with 0, 40 or 80 μM decursin for 24 h and subjected to apoptosis assays. (A) Cell death was determined by the calcein-AM-based Live/Dead assay as described in Materials and methods. Red highlights dead cells, and green highlights live cells. Percent of dead cells was represented. (B) Cells were labeled with TdT-mediated dUTP nick end labeling (TUNEL) and analyzed by flow cytometry. (C) For cell cycle analysis, decursin-treated cells were stained with PI after fixing in 75% ethanol. DNA contents of sub-G1 were analyzed by flow cytometry. The data represent mean ± S.D. Statistically significant difference was calculated by Student's t-test. *, p < 0.05, **, p < 0.01 and ***, p < 0.001 versus control.


