
Figure 1.
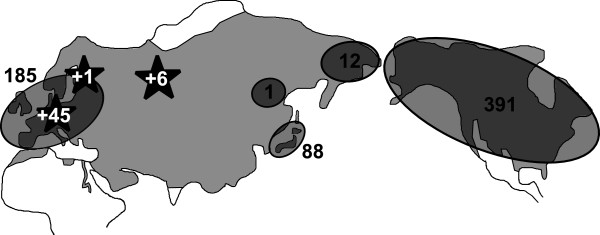
Map of sample locations for all sequences used in this study (published data and newly generated data). Current distribution range of the red fox [84] is shown in light grey. Black stars with white numbers indicate sampling locations for new data generated in this study. Circles indicate sampling regions from previous studies, with black numbers denoting numbers of published sequences for these regions. Details on all sequences used in this study are given in Additional file 1.