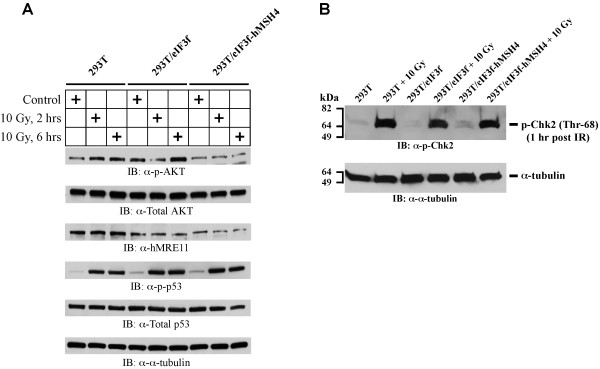
Figure 7.

Immunoblotting analysis of IR-induced AKT (Ser473) activation. (A) The levels of AKT activation were measured by AKT Ser473 phosphorylation in 293T, 293T/eIF3f and 293T/eIF3f-hMSH4 cells treated with 10 Gy IR in comparison to untreated controls. Levels of p53 Ser15 phosphorylation and the total protein levels of AKT, hMRE11 and p53 were also analyzed. α-tubulin was used as a loading control. (B) The levels of Chk2 activation (Chk2 Thr68 phosphorylation) in 293T, 293T/eIF3f and 293T/eIF3f-hMSH4 cells in response to 10 Gy IR. Cell lysates were prepared at 1 hr post IR treatment. Untreated cells were analyzed as controls, while α-tubulin was used as a loading control.
