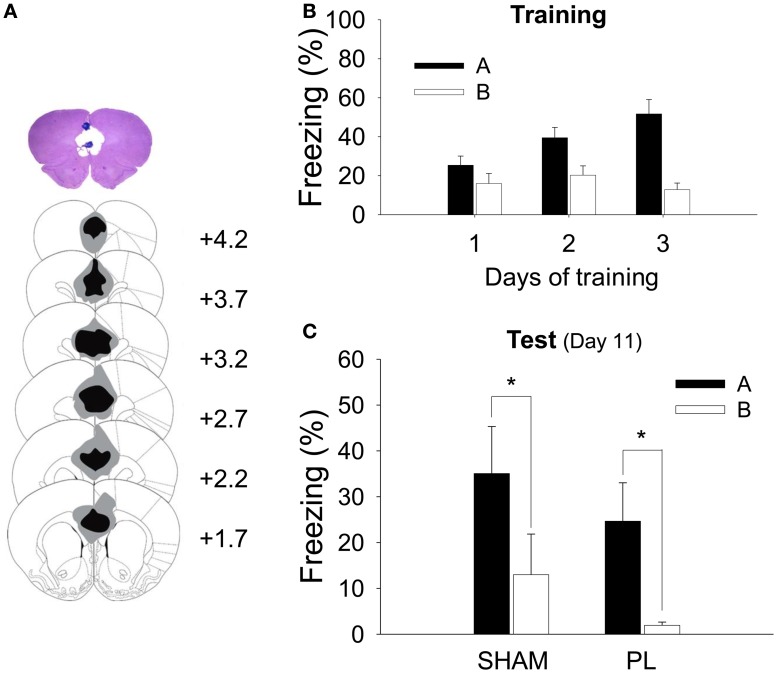
Figure 3.
Histological verification of the PL lesion and simple context discrimination. (A) A high-resolution scan of a cresyl-violet-stained coronal section shows a representative PL lesion (top), and the reconstruction shows the extent of the electrolytic lesion (bottom). The gray shading depicts the largest and the black depicts the smallest lesion on the matching coronal sections (Paxinos and Watson, 1998). (B) During training, all animals gradually acquired fear responses to Context A but not to Context B. (C) After the surgery, both SHAM and PL lesion groups continued to show differential response to the two contexts as indicated by a higher level of freezing to Context A than that to Context B. *denotes p < 0.05.

