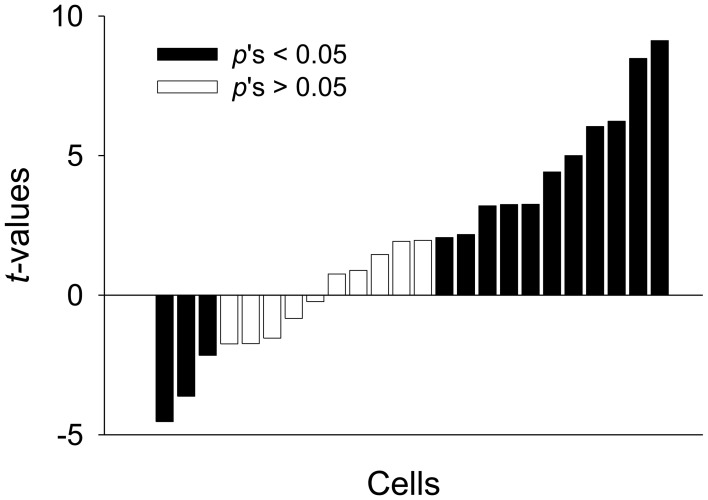
Figure 7.
Modulation of activity in PFUs. The direction and amplitude of the modulation are expressed as paired t-values for each unit, which were computed from Z-score differences between Context A and B. The t-values were arranged in the order from the most negative to most positive values. A positive value indicates more activity in Context A. The dark bars represent statistically significant differences in firing rate between the two contexts and white bars represent non-significant differences.

