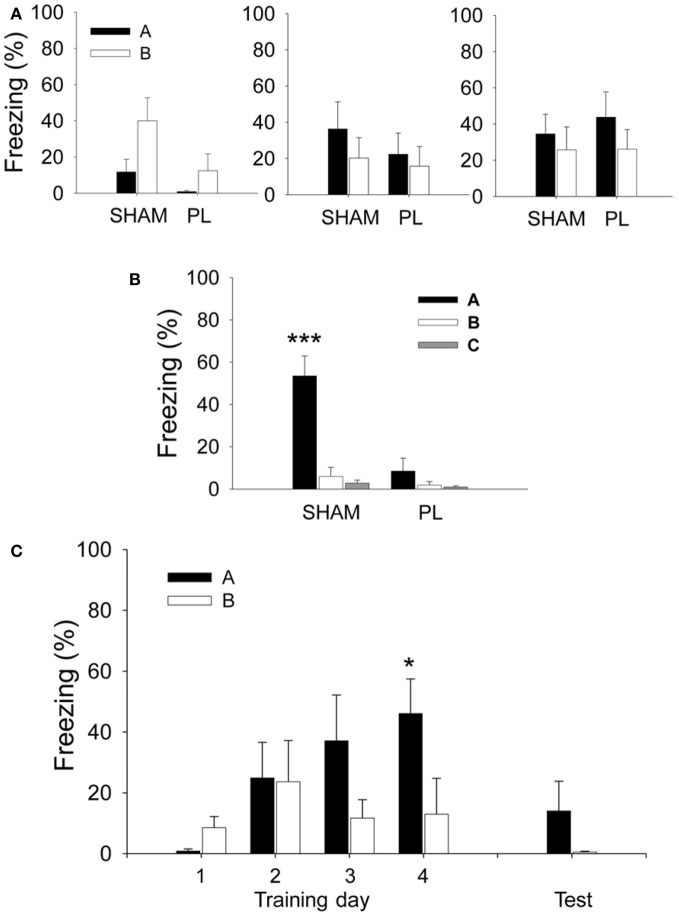
Figure A2.
Mean percentage of freezing during the pre-tone period before the presentation of the first CS. (A,B) In the lesion experiment, both SHAM and PL lesion groups showed a similar level of pre-tone freezing across the 3 days of training (A). However, on the test session (B), the SHAM group developed a pre-tone response that discriminates Context A from other contexts, as opposed to the PL lesion group which continued to show non-differential responses in all three contexts. (C) In the recording experiment, the rats displayed similar levels of pre-tone freezing in Context A and B across the first three training sessions and testing, but not on training day 4 in which they showed differential responses. * and ***denote p < 0.05 and p < 0.001, respectively (RM ANOVA followed by Fisher's least significant difference test).

