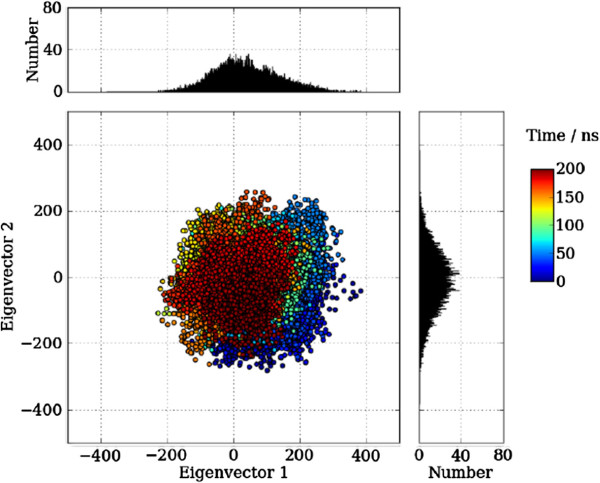
Figure 2.
Plot of the trajectory from an Amber simulation. Plot of the trajectory from an Amber simulation of CAP (pdb: 1G6N) onto the two lowest frequency eigenvectors. Each trajectory position is plotted as the dot product of the co-ordinates and the eigenvector, representing the extend of the displacement along each eigenvector from the average position. The distribution of these values are displayed as the adjoining histograms. The colour of the points responds to the simulation time.

