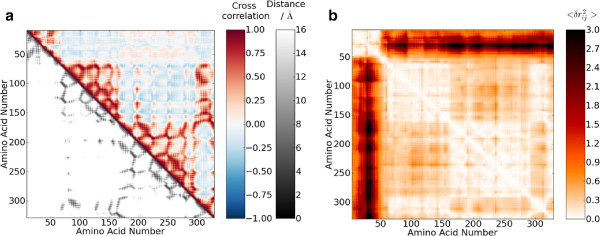
Figure 3.

Cross correlation and mean square fluctuations. Plots of (a) the cross correlation of the residue motions and the distance between the Cα atoms, and (b) the mean square fluctuations of each residue for LAC (pdb: 1EFA). The cross correlation of the Cα atom motion is calculated from Equation 11 which defines how similar the motion direction is, 1 is identical motion, 0 is completely different motion, while -1 is exactly inverse motion. The mean square fluctuations of each residue is calculated from Equation 12 and represents how much the distance between each residue varies during the natural protein motion.
