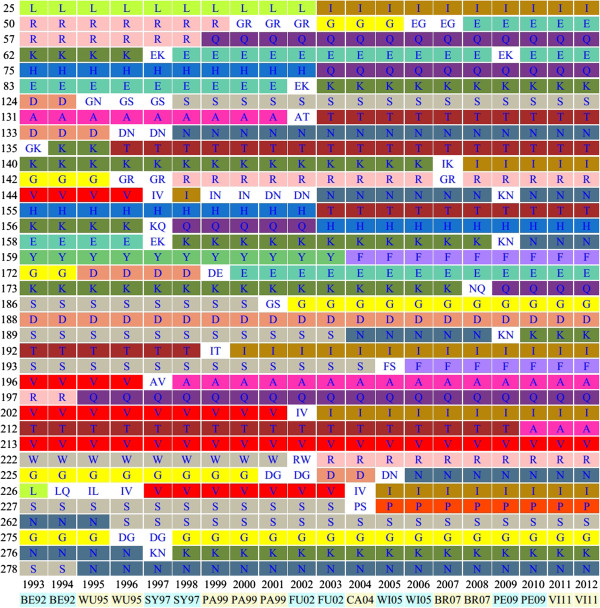
Figure 1.

Evolutionary dynamics of human influenza A/H3N2 viruses. Each row represents a single amino acid site on the HA1 domain. Each column represents single or multiple major amino acid (MAA) of the site in a year. Varied colors and white were used to label the single MAA and multiple MAAs, respectively. Vaccine strains listed below the year denote annual influenza epidemics.
