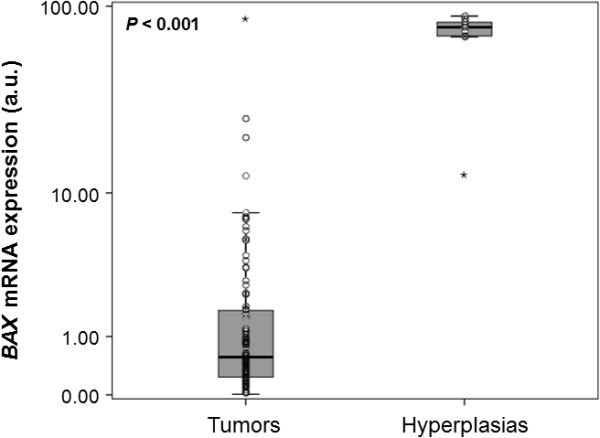
Figure 1.

Comparison of the distribution ofBAXmRNA expression in malignant nasopharyngeal tumors and hyperplastic nasopharyngeal tissues.BAX transcripts encoding proapoptotic protein isoforms are far less abundant in NPC specimens than in hyperplastic tissue biopsies (P < 0.001). The P value was calculated using the non-parametric Mann–Whitney U test. The dark line near the middle of each box indicates the 50th percentile (the median value) of each group, the bottom and top of each box represent the 25th and 75th percentile, respectively, and whiskers extend to 1.5 times the height of the box; the points represent outliers, while the asterisks show extreme outliers.
