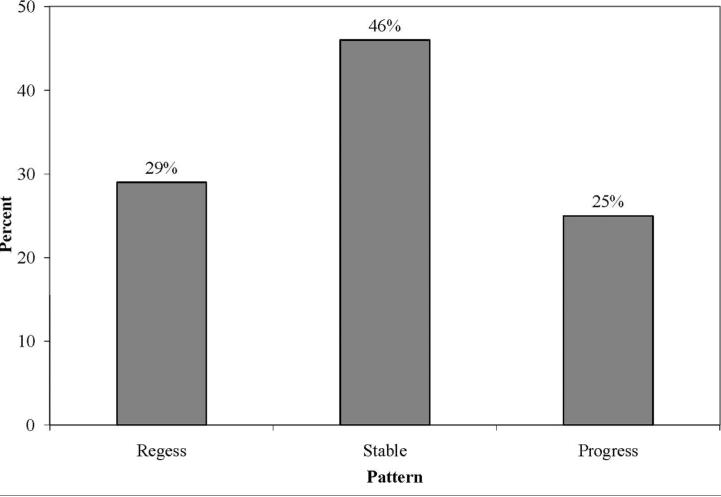
Figure 2. Patterns of Stability and Change in Stages Over a 2-Month Interval.
T1, time 1; T2, time 2 (2 months after T1). Regress indicates backward movement to an earlier stage from T1 to T2; stable, no change in stage from T1 to T2; and progress, forward movement to a later stage from T1 to T2. Bars represent the percentages of youths evidencing each pattern.

