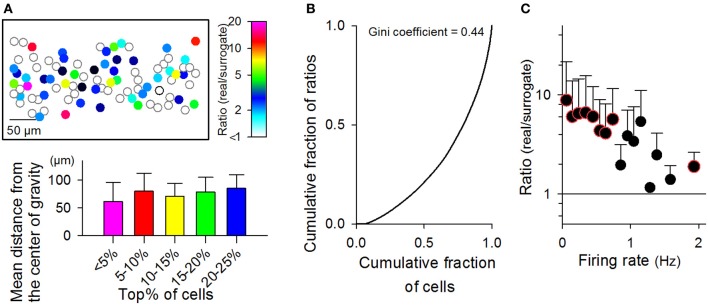
Figure 10.

Relationship between the firing rates of neurons and their MSS participations. (A) Top: a cell map representing the number of individual cells participating in MSSs during the observation period. Data are shown as the ratio of the real rastergrams to their randomized controls. Bottom: The mean Euclidean distance to the center of gravity from individual cells with the highest x% of the real-to-surrogate ratio. The ranges of x values are indicated in the abscissa. For example, in the case of 5–10%, we selected cells with the real-to-surrogate ratios that ranged from the top 5 to the top 10%, calculated the center of gravity of those selected cells, and measured the mean distance from those cells to their center of gravity. (B) A Lorenz curve representing the proportion of real-to-surrogate ratios assumed by the proportion of cells with the lowest ratios. A Lorenz curve is used to show the degree of “inequality” of a distribution defined by two variables (herein, the real-to-surrogate ratio of individual cells versus the number of cells with a given real-to-surrogate ratio). The inequality can be represented by a Gini coefficient, a number between 0 and 1, where perfect equality has a Gini coefficient of zero, and absolute inequality yields a Gini coefficient of 1. In this case, the Gini coefficient was 0.44. (C) The ratios of the numbers of MSS participations of individual cells in real datasets to the mean values in 20 randomized surrogates are plotted against their mean firing rates. Color-edged circles are 5% significant data points between real datasets and surrogates (paired-t test). The data are the mean ± SDs of 9 videos.
