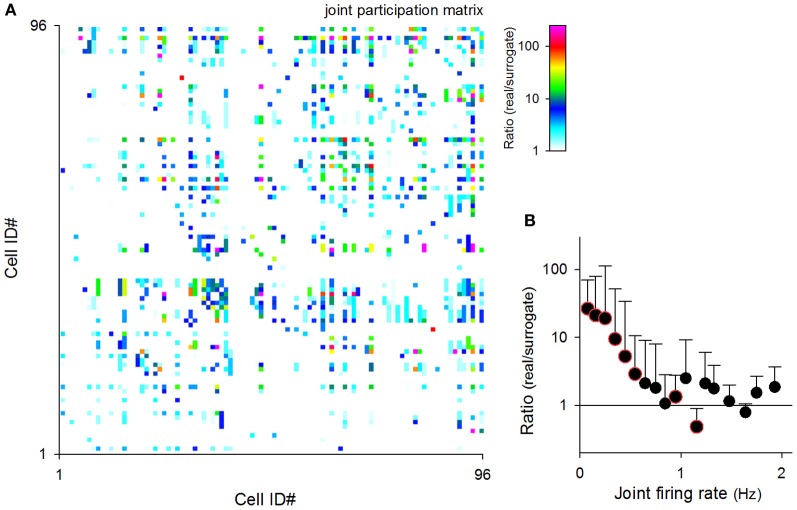
Figure 11.
Relationship between the joint firing rates of neuron pairs and their MSS joint participations. (A) A pseudo-colored matrix representing the numbers of joint participations by two given cells. Data are shown as the ratio of the real rastergrams to their randomized controls. (B) The ratios of the number of MSS co-participations of cell pairs in real datasets to the mean value of 20 randomized surrogates were plotted against their mean joint firing rates. Color-edged circles are 5% significant data points between real datasets and surrogates (paired-t test). The data are the mean ± SDs of 9 videos.

