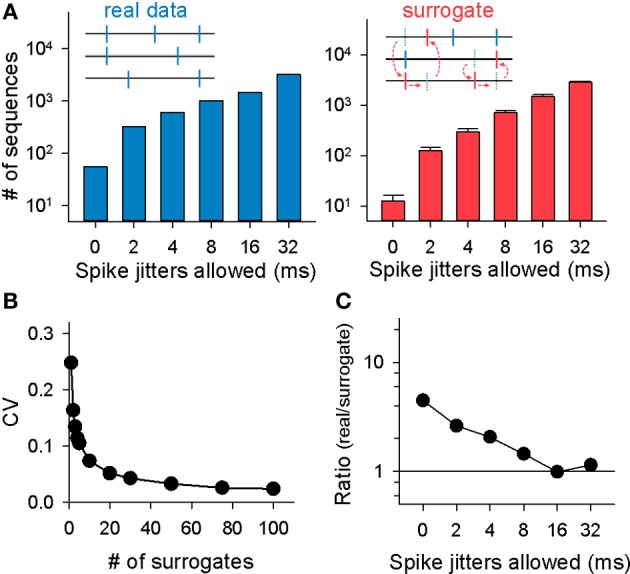
Figure 3.

Monte Carlo evaluation for the significance of MSSs. (A) Left: the total numbers of MSSs in the rastergram shown in (A) are plotted as a function of spike-time jitters allowed for MSS detection. Right: MSSs were identified in the same way in spike-shuffled rastergrams. Data are the mean ± SDs of 20 surrogates. (B) Relationship between the CVs of the number of MSSs detected in surrogates and the number of surrogates generated. (C) Ratios of the numbers of MSSs in the original (real) rastergram to the mean numbers of MSSs in 20 randomized surrogates. Data are the same as (B).
