
Figure 7.
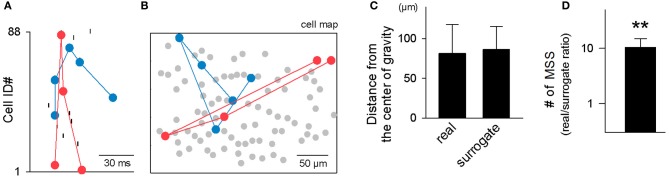
Spatial dispersion of MSSs. (A,B) Two representative MSSs in a rastergram (A) and in a cell map (B). (C) The mean Euclidean distance from individual cells that participated in a MSS to the center of gravity of all cells that participated in the MSS was compared surrogates in which the same number of cells in the original MSS were selected randomly from the same cell map. This comparison was repeated for 27,804 MSSs in 9 videos, and data are shown as the mean ± SDs. (D) The number of MSSs was still overrepresented in surrogates generated by activity shuffling in which spatial configurations were preserved. **P < 0.01, paired t-test. The data are the mean ± SDs of 9 videos.