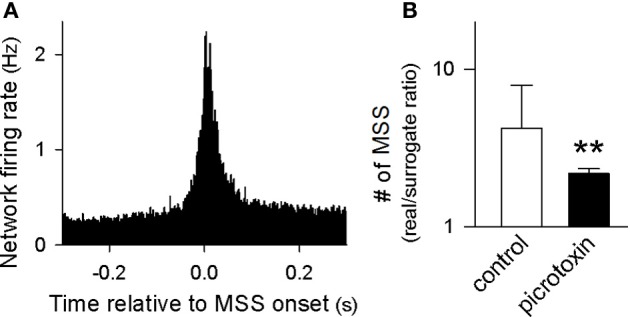
Figure 9.

Mechanisms of MSSs. (A) Peri-MSS time histogram of the mean firing rates of all neurons monitored in 9 videos. The firing rates were aligned at the time relative to the onset of 27,804 individual MSSs. (B) The number of MSSs relative to chance were decreased by bath application of 50 μM picrotoxin. **P < 0.01 versus control, Student's t-test. The data are the mean ± SDs of 9 videos.
