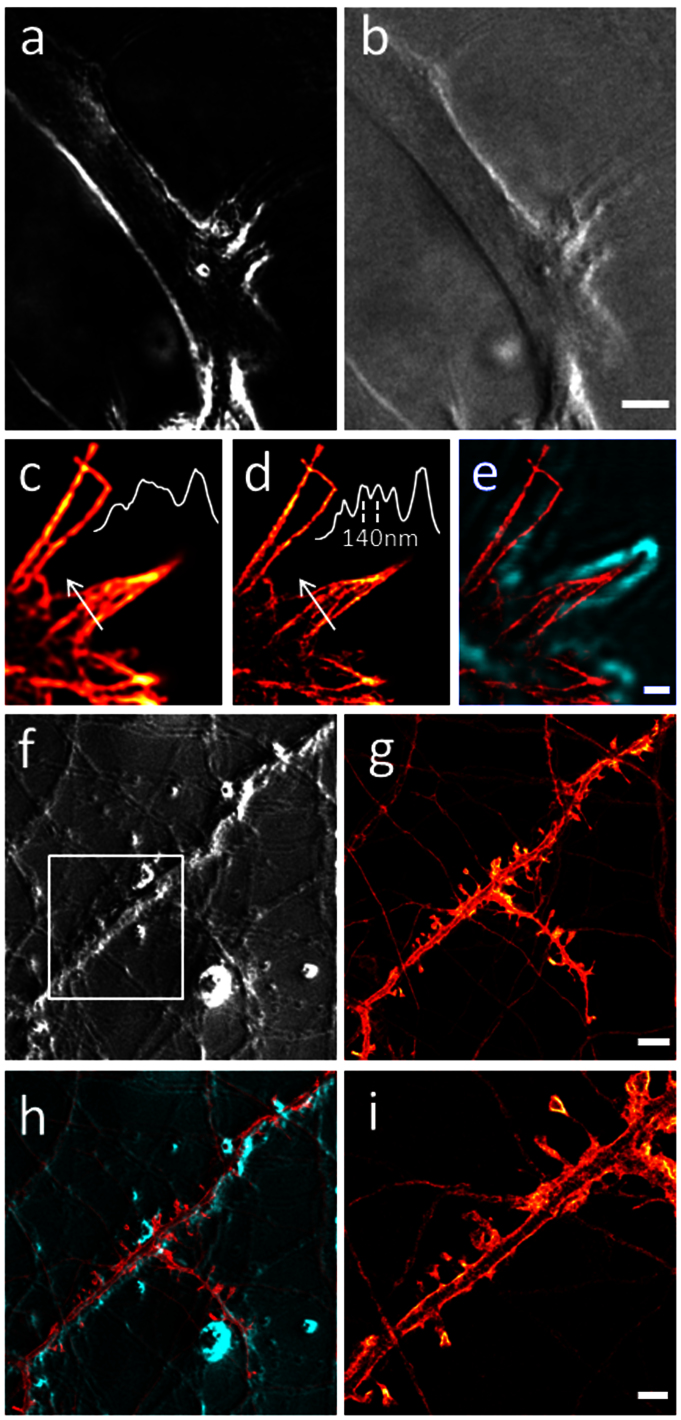
Figure 3. Scanning confocal SPC visualizes weak phase objects.
(a) Symmetrical illumination highlights contours of an astrocyte in an indexmatched mounting medium on a dark background. (b) Asymmetrical illumination shows the astrocyte with shadow effects on an elevated background as in DIC. (c) Immunostained actin filaments in the fine protrusions of neuronal growth cones (confocal fluorescence imaging). (d) STED imaging resolves details of the actin organization. Insets in (c) and (d) show intensity profiles along the white arrows. (e) Scanning confocal SPC (green) enables visualizing the fine protrusions in phase contrast. The symmetrical contour detection allows for an overlay with the STED image (red). (f) SPC visualizes the neuronal network of living neurons. (g) confocal fluorescence image. (h) SPC and confocal images are perfectly registered since they are recorded in the same scanner. (i) STED microscopy resolves spine morphology in YFP-transfected living neurons in the region indicated by the white box in (f). Scale bars: (b) 5 μm; (e) 0.5 μm; (g) 5 μm; (i) 2 μm. Panels (c), (d), (g), (i) use the same color scale as indicated in Fig. 2 a.

