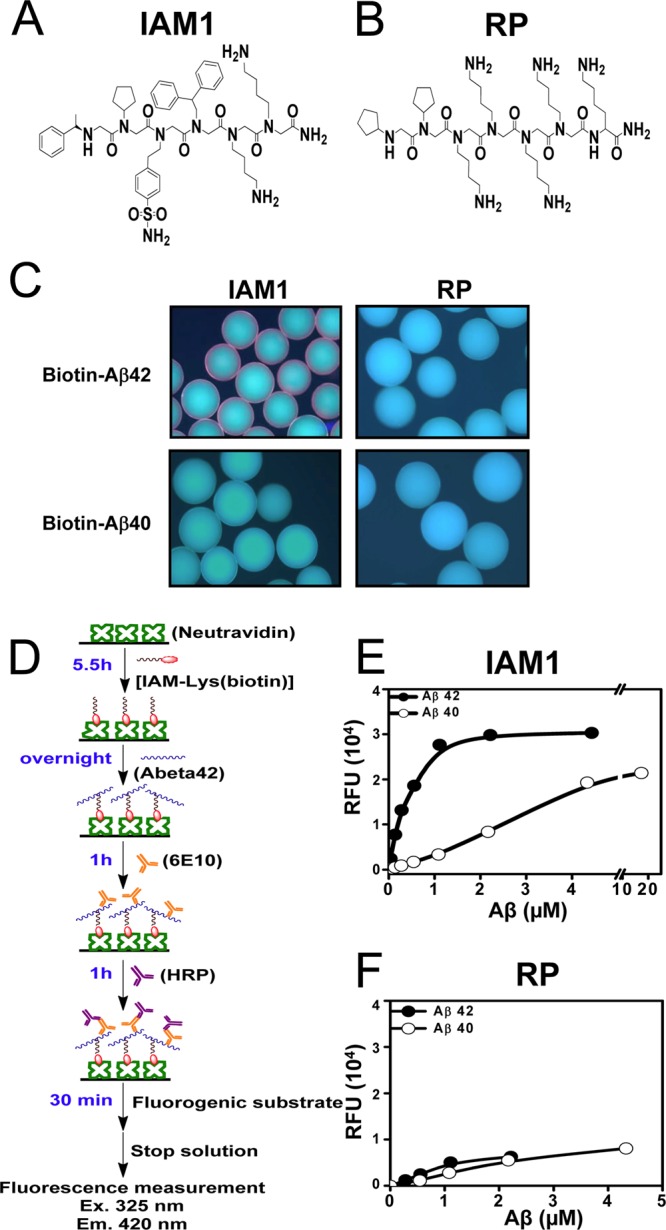
Figure 2.

Quantitative binding affinity of peptoid IAM1 to Aβ42 and Aβ40. (A) Chemical structure of the peptoid IAM1 identified from the screen of the library. (B) Chemical structure of a random peptoid (RP) used as a negative control. (C) Biotin-Aβ42 and biotin-Aβ40 binding assay with IAM1 and RP peptoid beads. (D) Principle of solid phase binding assay with fluorescent readout. (E) Solid-state binding curve for IAM1 peptoid using synthetic Aβ42 and Aβ40. (F) Solid-state binding curve for RP peptoid using synthetic Aβ42 and Aβ40. In panels (E) and (F), the average fluorescence reading at each Aβ concentration is shown as mean ± SE (n = 3). The average fluorescence data were fitted with a nonlinear regression curve using one site binding equation.
